The project involved using SQL to clean and explore a database with 60,000 unique records, clustering data to unveil Maji Ndogo's water crisis, weaving the data threads of Maji Ndogo's narrative, and charting the course for Maji Ndogo's water future.
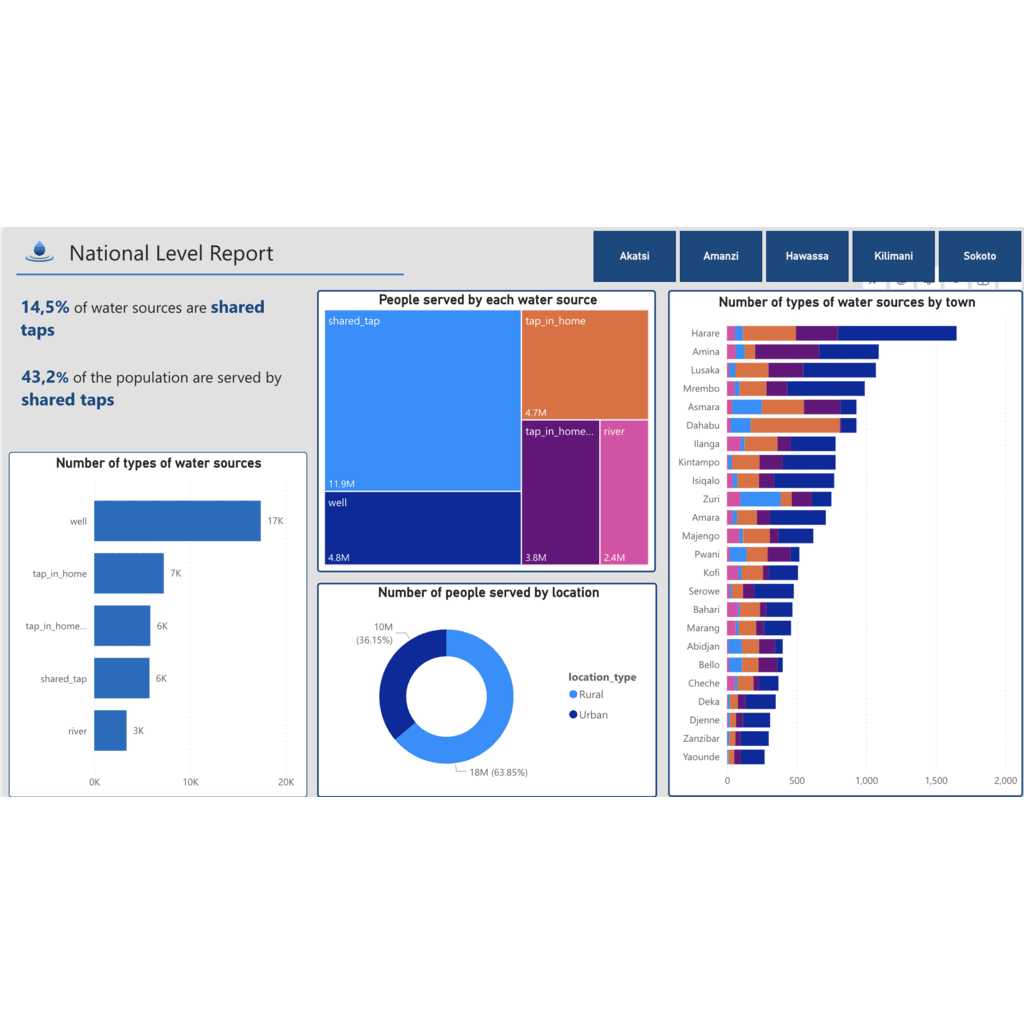
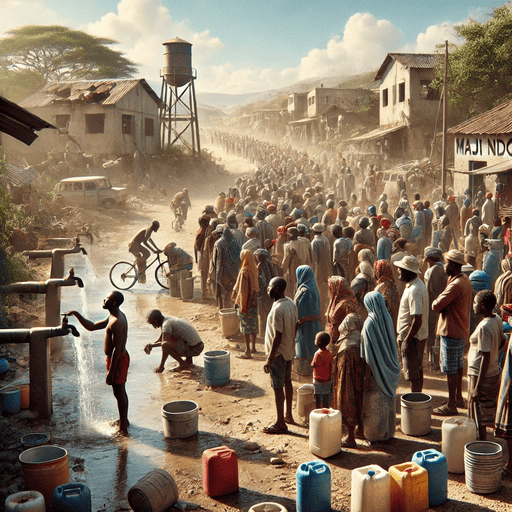
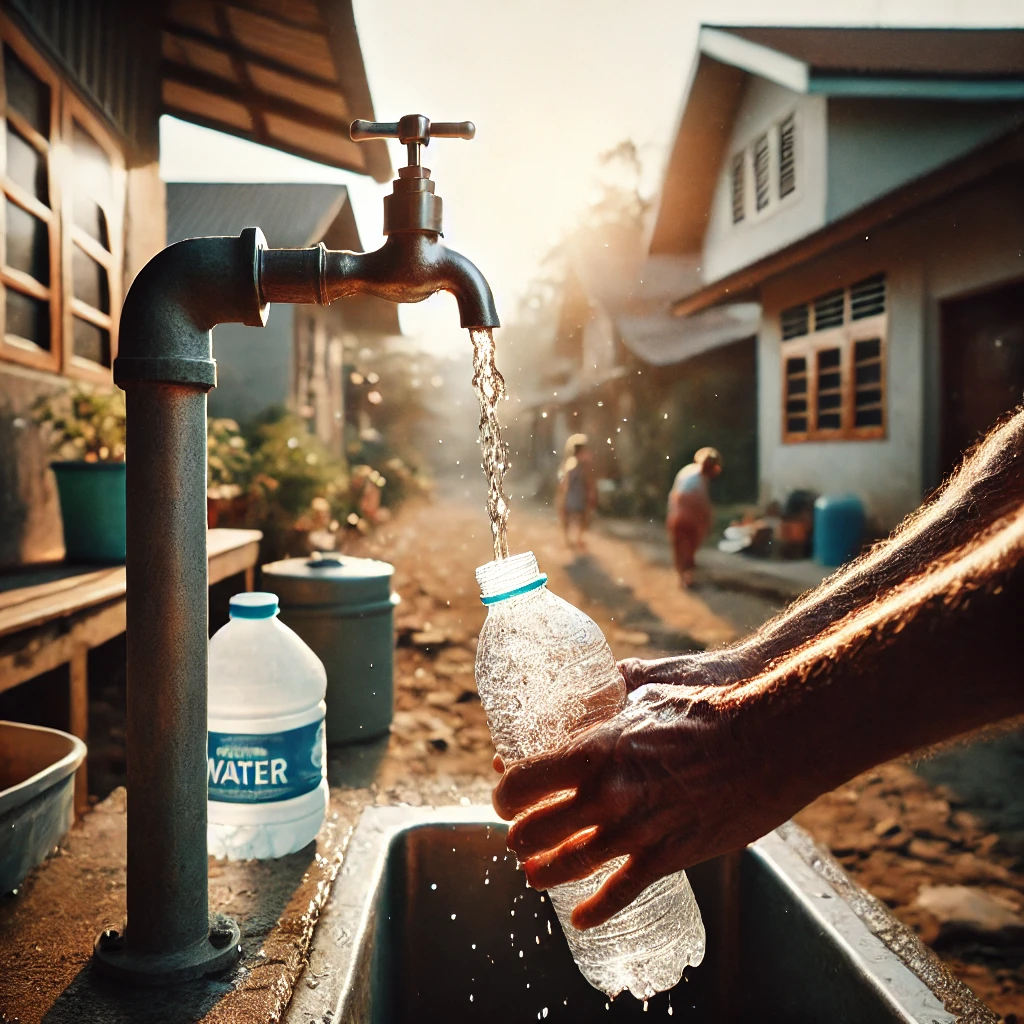
this project involved leveraging Power BI to build an interactive dashboard that brought the SQL findings to life. Visualizing insights from 60,000 unique records, the dashboard revealed critical patterns in water usage, crisis areas, and strategies for resource optimization. Through dynamic and intuitive visuals, the data offered a clear, actionable narrative, supporting informed decisions for sustainable water management in Maji Ndogo.

The project involved using Tableau to visualize and analyze coffee shop sales data, uncovering key sales trends, customer behaviors, and product performance. It weaves together the story of sales growth and decline, and charts the future course for optimizing coffee shop operations based on insights from the data.
The project involved using Google sheet to investigate access to safe and affordable drinking water, focusing on inequalities in service levels between different countries and regions.